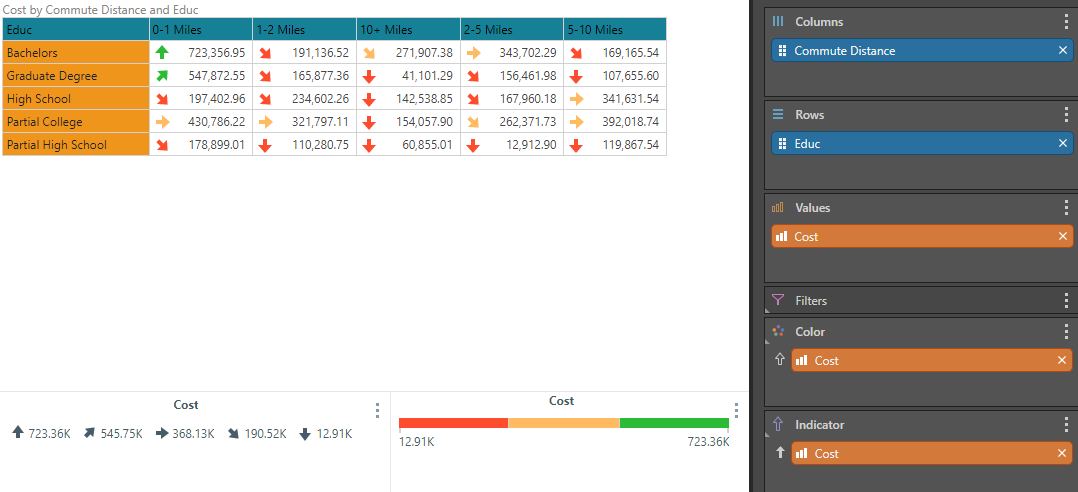
The Indicator drop zone is used in grids to drive mini KPI adjustments to the grid's cells. When used with gauge visualizations, the indicator drop zone is called the "Status drop zone" - which reflects an almost identical function, and drives the gauge's primary status value and its graphics.
- Click here to see more examples of using the Status Indicator for Gauges
Conditional Formatting
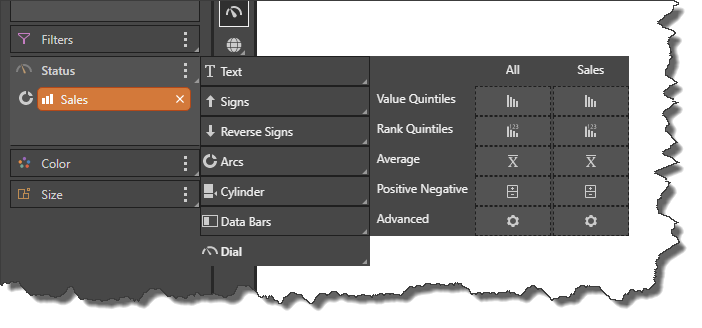
The indicator drop zone presents users with the flexibility to choose the KPI icon in the grid or gauge and the actual logic for how to adjust that icon. This is therefore a mechanism to drive conditional formatting logic in grids and gauges, since it formulaically formats and adjusts the icons with logic like averages, linear scale or percentiles. This conditional capability is not exclusive to the Indicator or Status Drop Zone - working equally well with the Color drop zone. It can also be enacted from various entry points, like the Conditional Formatting context menu or dialog.
Indicators: Grids
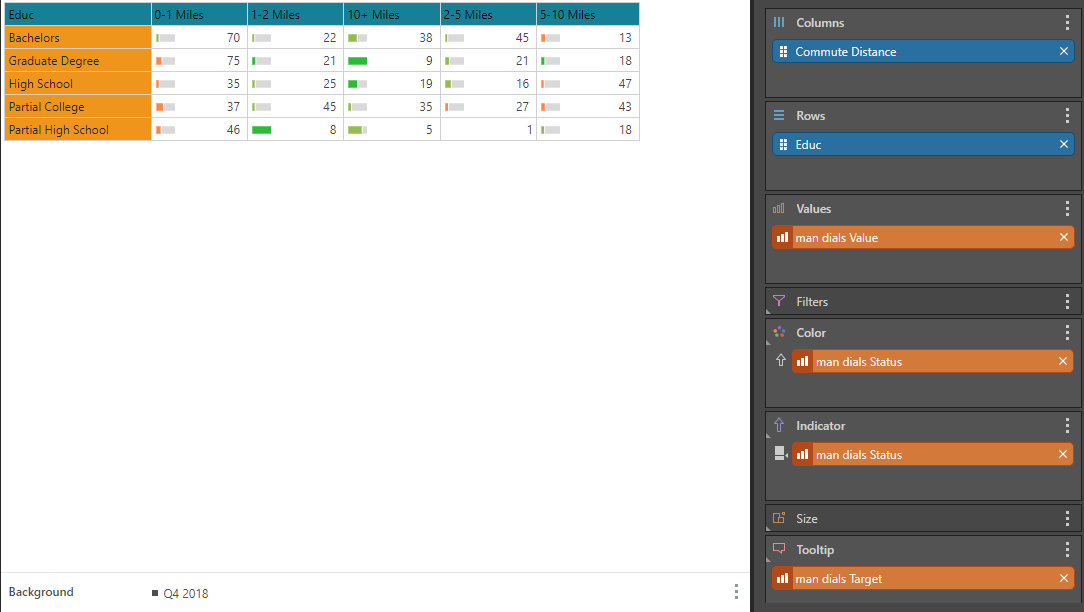
The Indicator drop zone is enabled when working with tabular grids, allowing you to add a single measure which will drive the indicators in the grid. By default, the status indicator does not include any color logic; however, you may add a measure to the color drop zone and select "Indicator" as the target, in order to add color logic to the indicators. Percentage indicators can be used to display a measure as an indicator using a text value.
KPIs
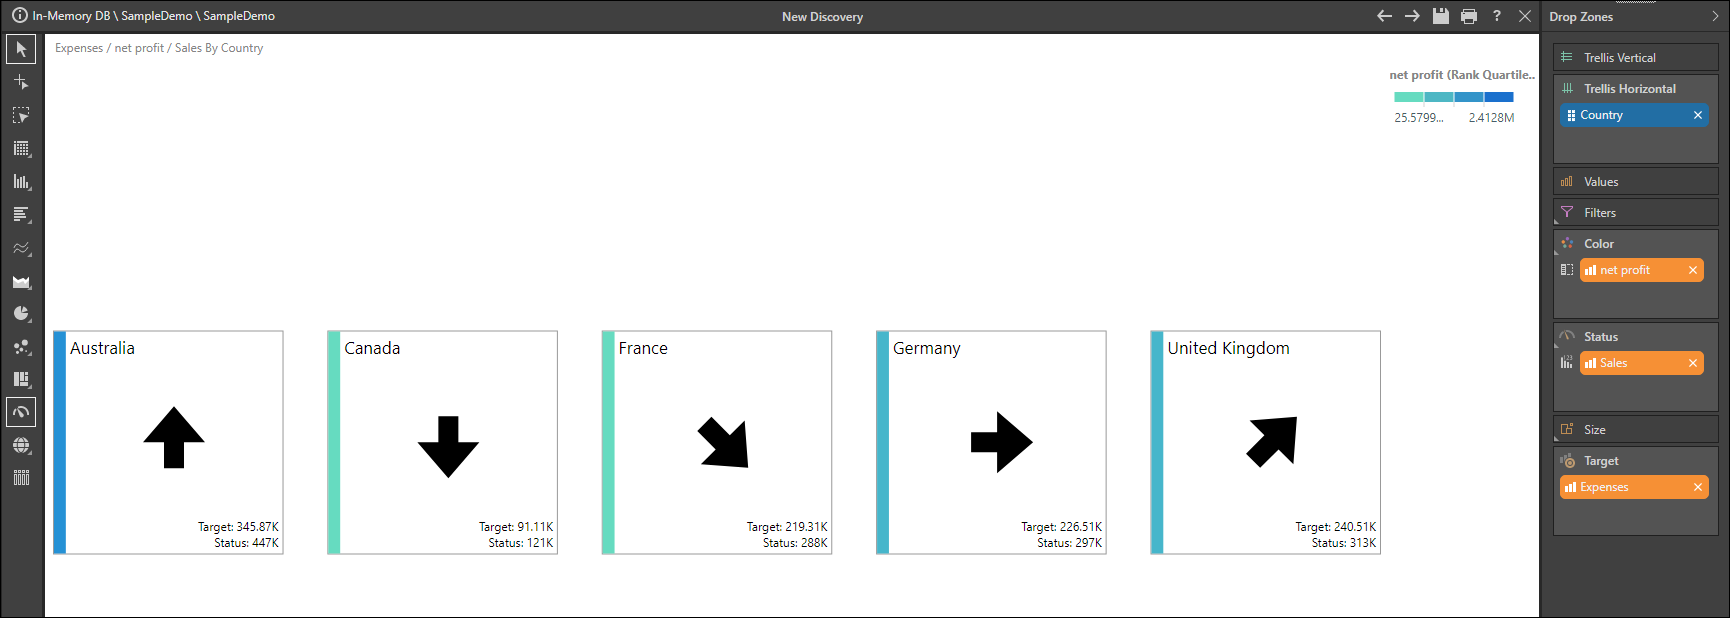
When working KPIs, the value that was assigned as the KPI's status will automatically be added to the Indicator, Color, and Tooltip zones. KPIs are comprised of an actual value, target value, and status value. Status values are a logical comparison of the actual to the target to express whether the actual is doing better, worse, or the same in comparison to the target value. In queries, the status values appear as numeric ranges or bands, which define the status of the actual value compared to the target value.
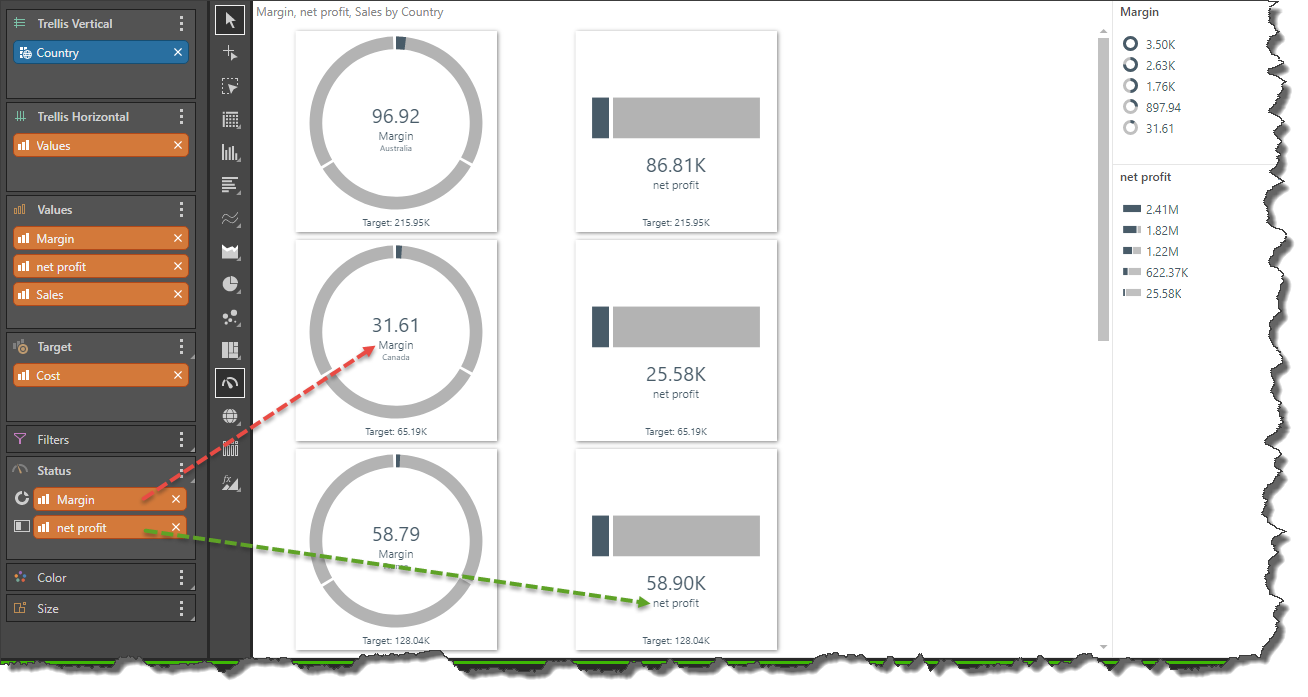
Status: Gauges
The Status drop zone is enabled when working with gauges; add a measure to the Status zone to add indicators to the gauge.
You may add multiple measures to the Status zone; in this scenario the gauges will automatically be trellised by the given Status values.
By default, the indicators do not have any color logic assigned to them (with the exception of Cylinders and Dials); you can assign color logic to the indicators from the Color drop zone.
In this example, the Sales measure is driving the status indicators, while the Net Profit measure is driving the sidebar color indicator.